Sky visualization with ESASky
The tab Visualise provides access to the ESASky portal with contents adapted to work with Euclid catalogues, observations, and mosaics. We will call this option Euclid Sky. All the features of ESASky are available in Euclid Sky, so it is recommended to get used to this tool with additional tutorials to explore and take advantage of all the possibilities offered.
Footprints overlay for Observations and Mosaics
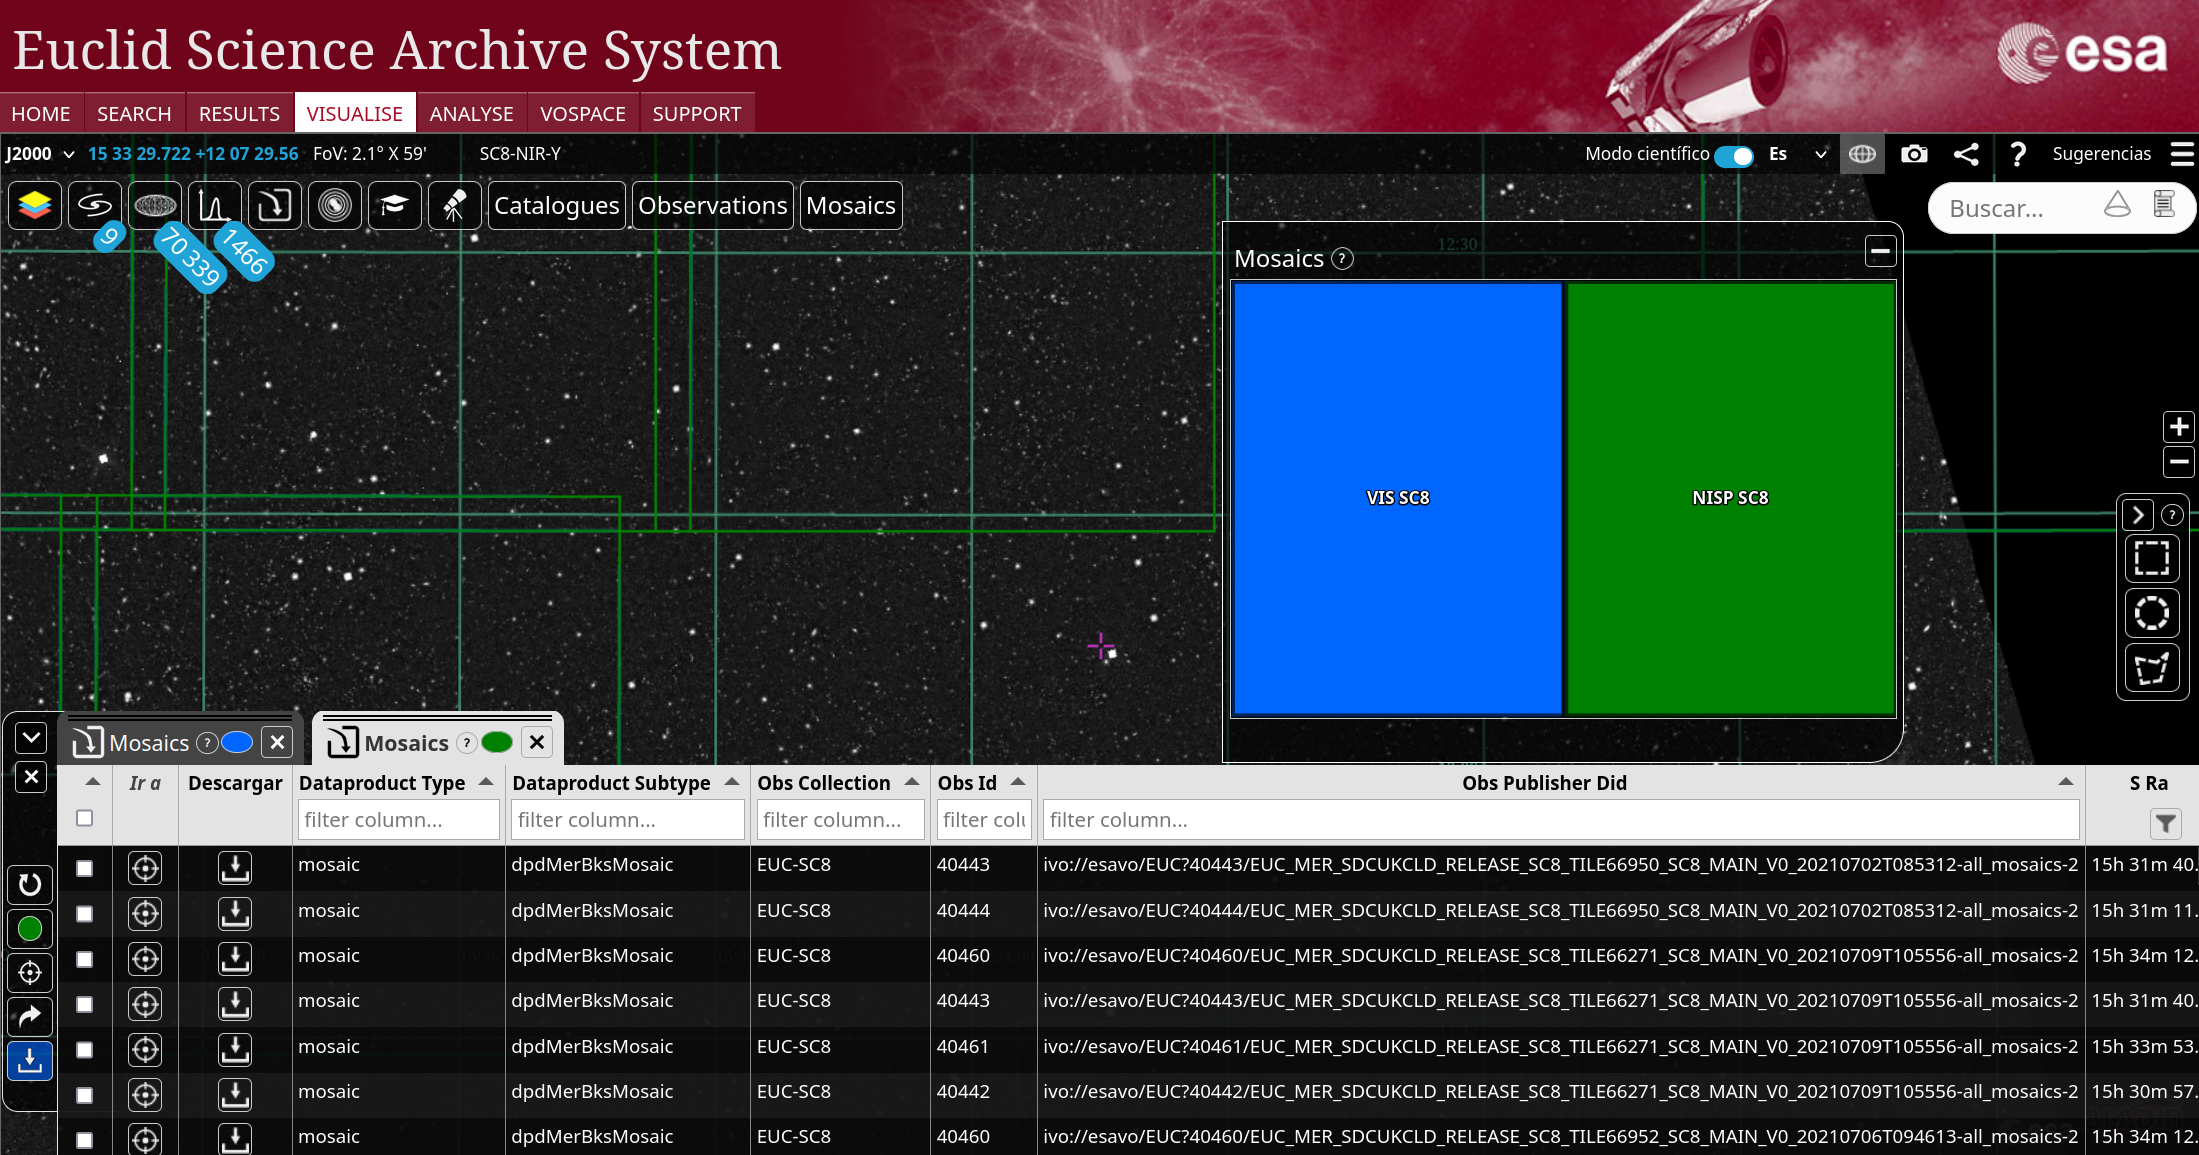
Observations and mosaics for VIS and NISP instruments can be selected from the top menu. This will display the footprints of each observation and the list of observations as a table at the bottom of the screen. The observations can be selected (will be marked in white in the sky) and downloaded. The observations or mosaics for each instrument will appear in different colors, blue for VIS and green for NISP, and it is possible to shown several of them simultaneously. Below the following screenshots show the footprints for VIS and NISP, first for Observations and the second one for Mosaics.

Catalogues overlay for public (anonymous) and private (authenticated) catalogues
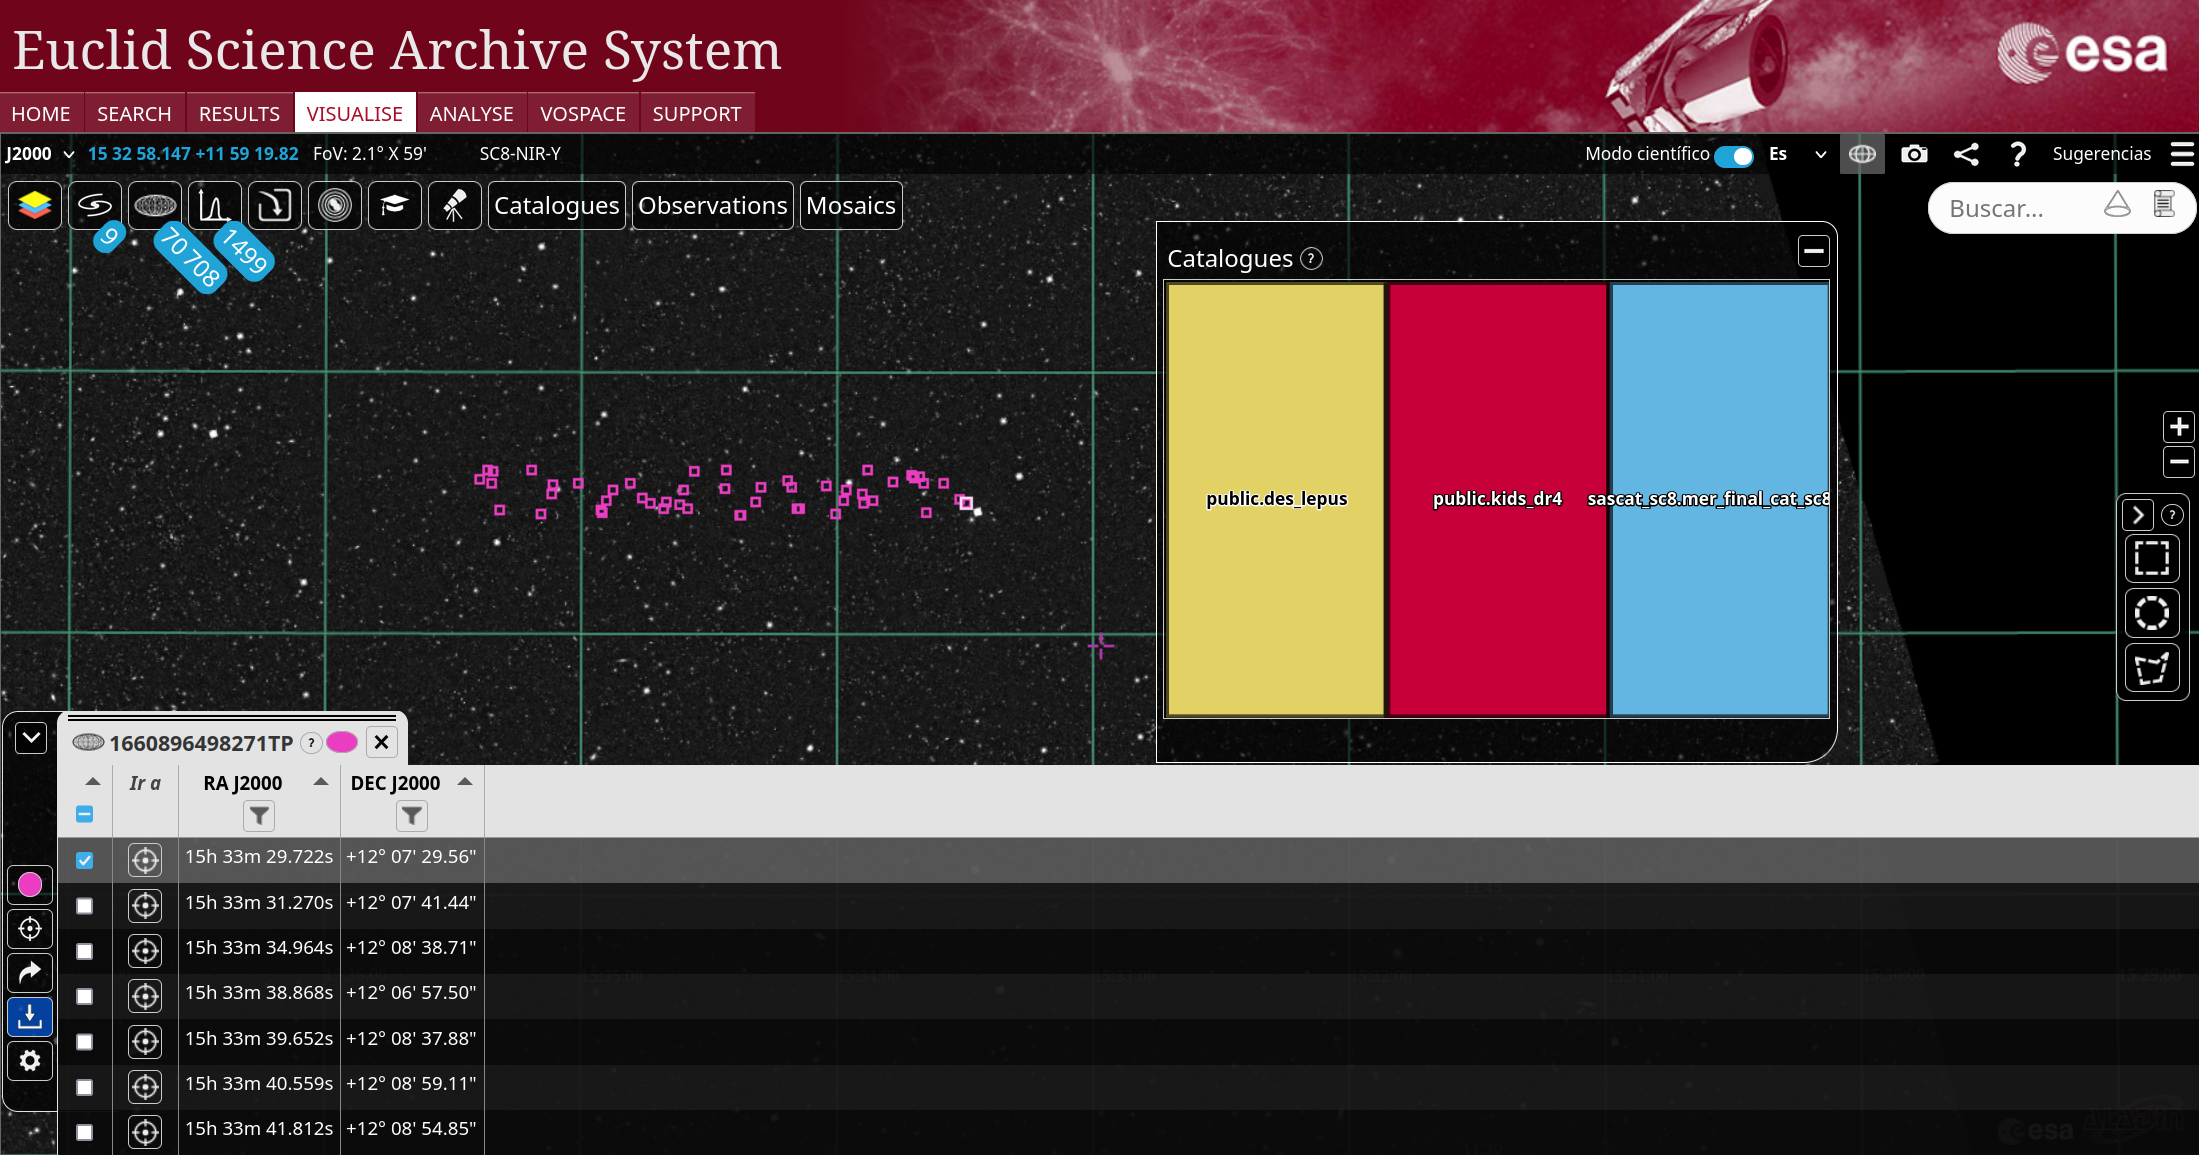
The procedure for public and private catalogues is identical. In the tab Search, option ADQL Form, it is possible to query objects using the ADQL language. The Catalogues option also allows to query catalogues and obtain the equivalent ADQL query for a given input. Once you have the results in the ADQL Form, one of the icons can be used to overlay the results in Euclid Sky.
Consider the following ADQL query (mer_final_cat_sc8 is a private catalogue):
SELECT TOP 50 mer_final_cat_sc8.declination,mer_final_cat_sc8.object_id,mer_final_cat_sc8.right_ascensionFROM sascat_sc8.mer_final_cat_sc8 The results of this query
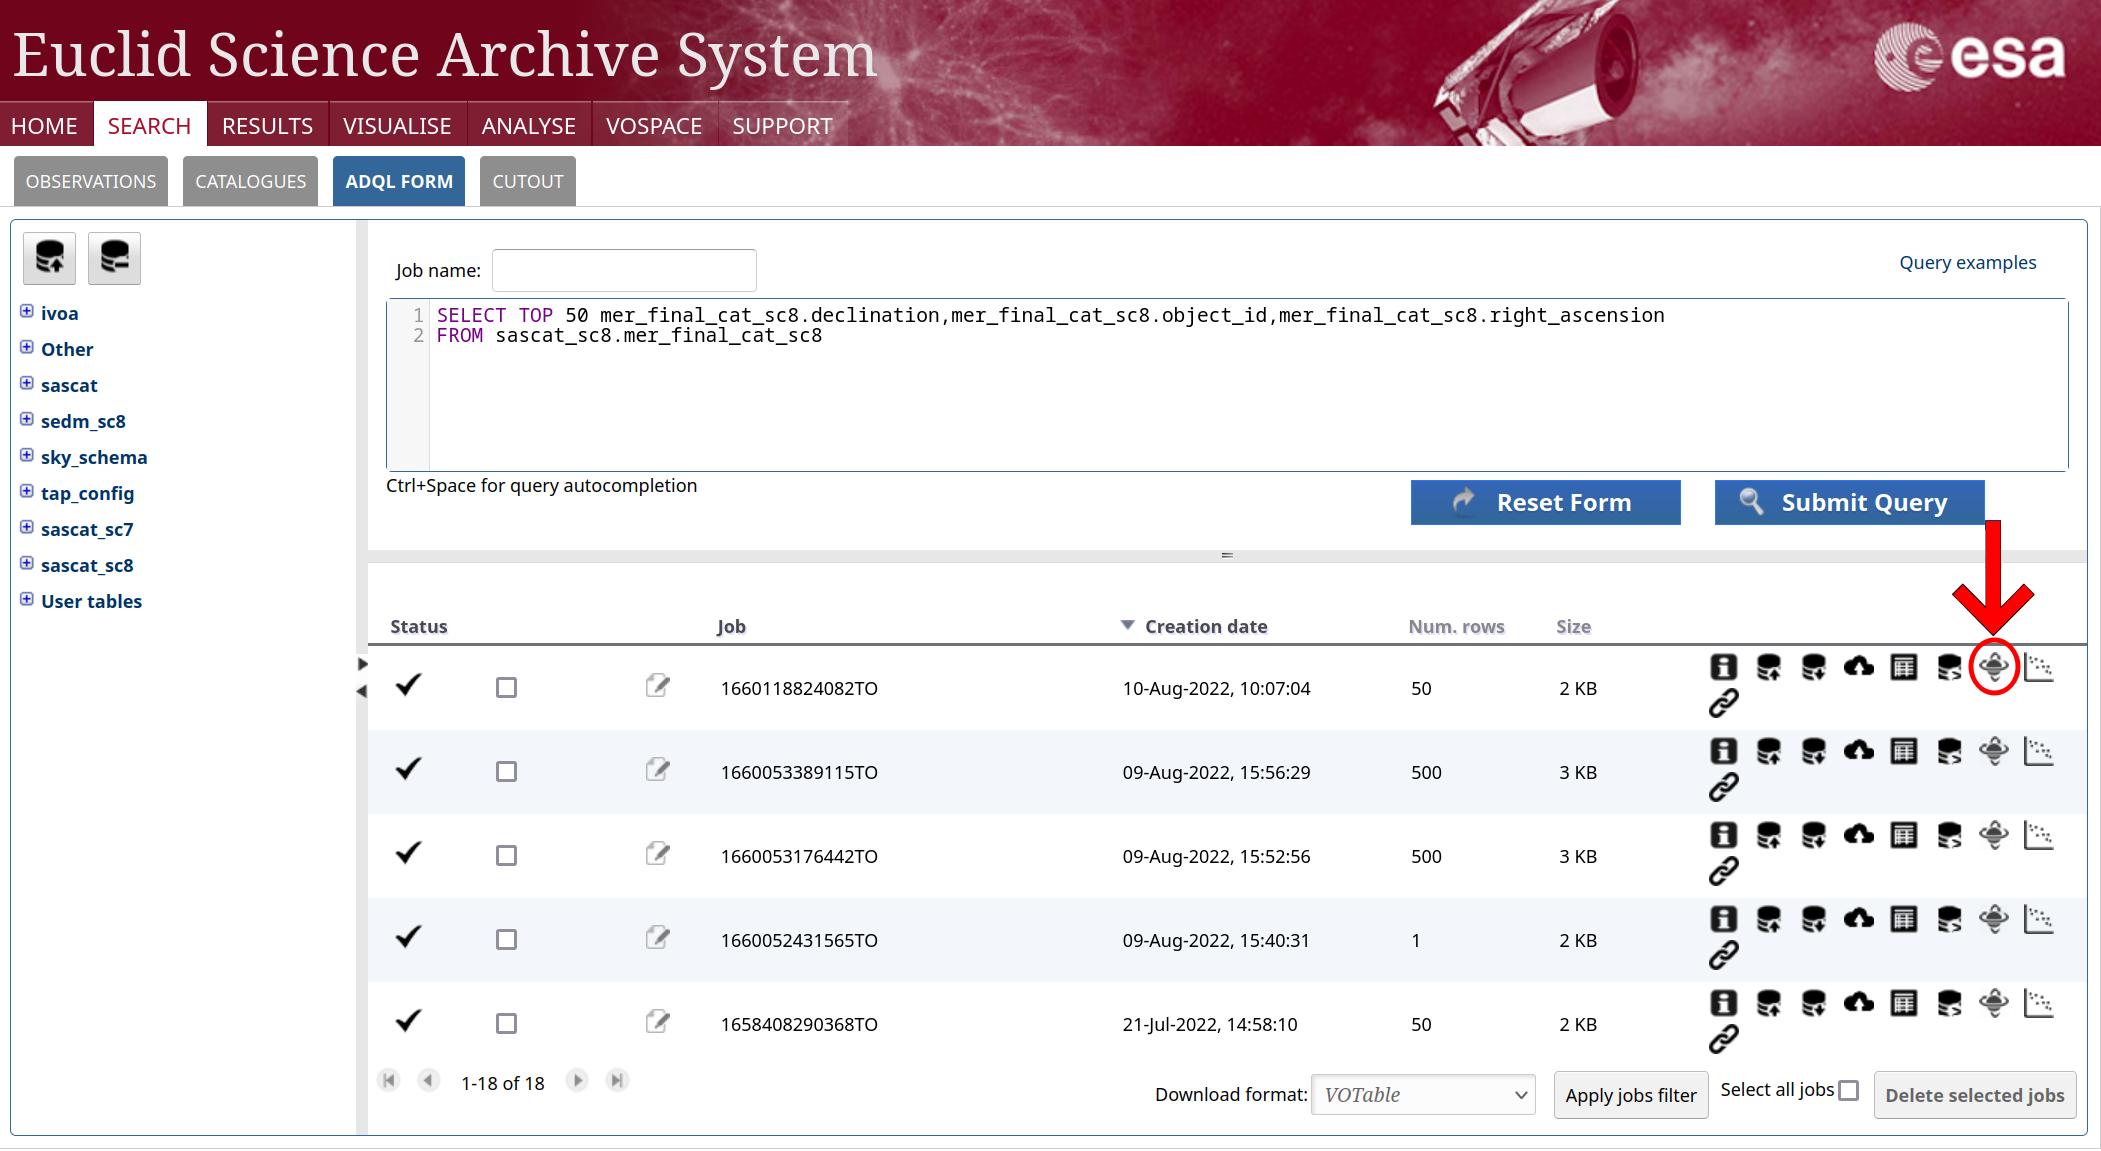
can be shown in Euclid Sky by clicking the icon marked in red in the previous image, and entering the correct information in the EAS Sky Overlay panel to identify the positional columns for the query.
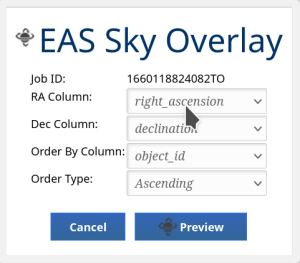
Then click on the Preview button in the previous panel and the sources will be shown in Euclid Sky. There you can select individual sources and show them on top of any Euclid map.